The True Cost of Sales Rep Turnover (and What the Numbers Say)
Sales rep turnover costs far more than most companies calculate. The recruiting fee is visible. The ramp cost, lost pipeline, manager distraction, and deal continuity damage are not, but they compound. With annual sales turnover averaging 35%, a 10-person team replaces three to four reps a year. This article breaks down where the money goes and how to calculate your actual exposure.
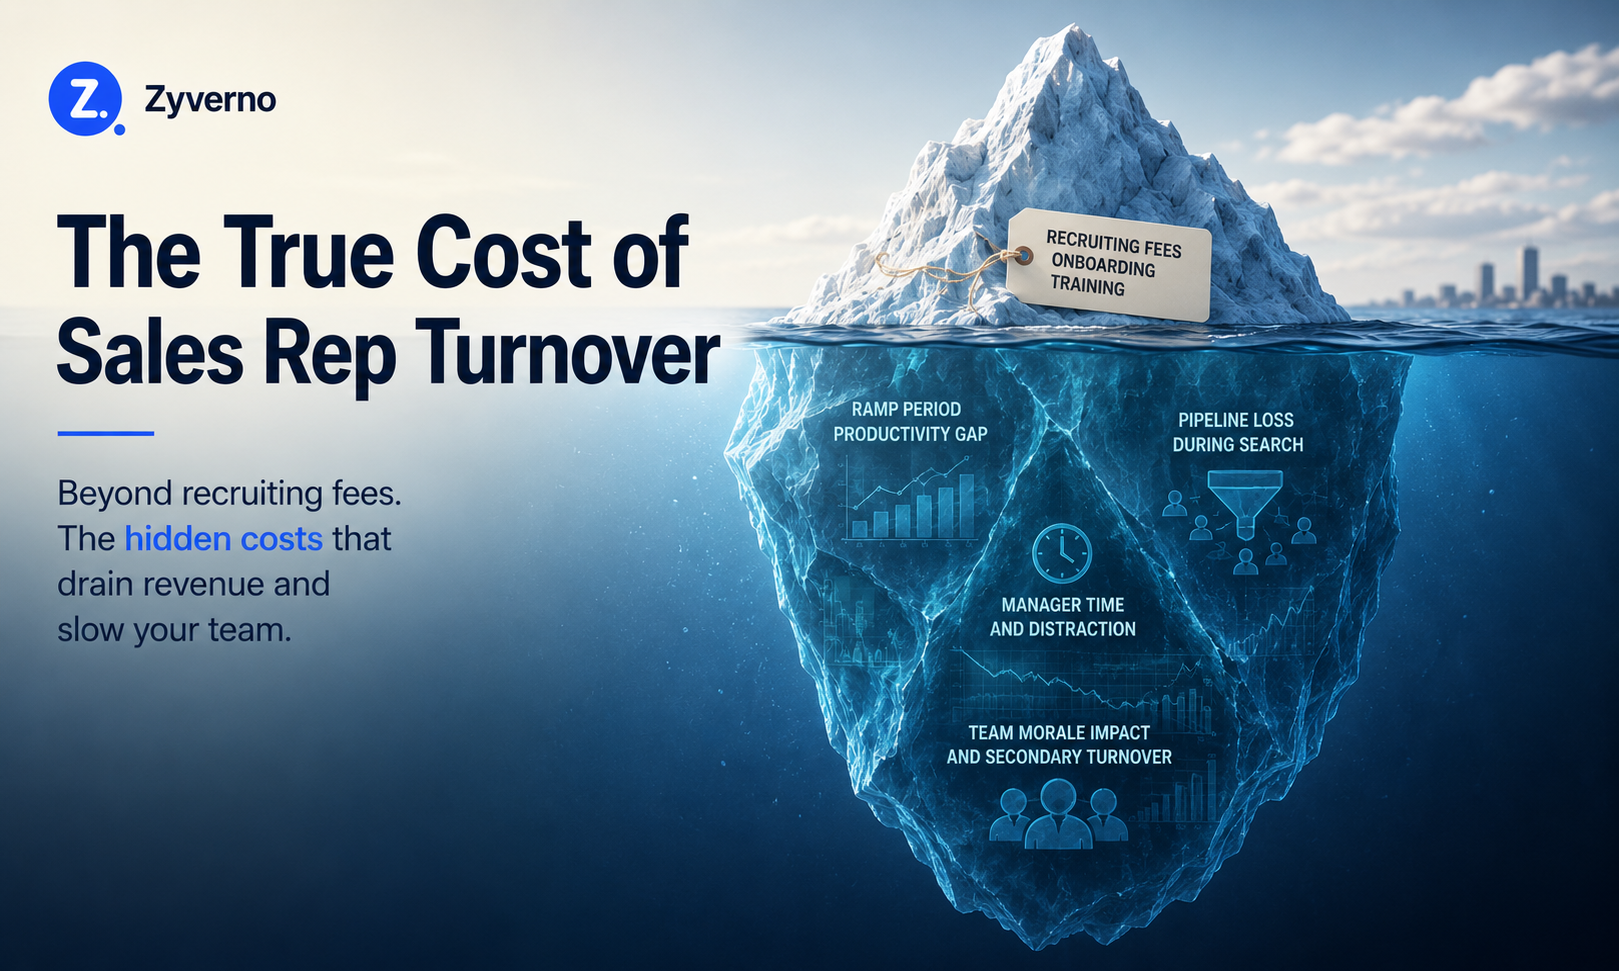
The Visible Costs
These are the costs most managers account for. They are the tip of the iceberg.
Recruiting and Hiring
Direct recruiting costs range from 15-25% of base salary for a contingency recruiter, or $3,000-$8,000 in job board spend and HR time for an internal search. For a sales rep with a $70,000 base, that is $10,500-$17,500 in direct recruiting costs before you have made an offer.
Add to that:
- Interview time: three to five hours per hiring manager across multiple rounds
- Offer negotiations and reference checks
- Background verification
- Onboarding administration
A realistic estimate for direct hiring process costs: $8,000-$20,000, depending on role level and process.
Training and Onboarding
Formal onboarding programs for sales roles typically run $2,000-$5,000 in direct costs (tools access, training materials, enablement resources). For roles requiring technical product knowledge, such as software-as-a-service account executives or complex business-to-business sales, that number is higher.
These direct costs don't capture the manager's time investment, which is substantial. Most reps require daily check-ins, call reviews, pipeline coaching, and deal support through the first 60-90 days.
The Hidden Costs (The Ones That Actually Dominate)
This is where most turnover calculations fall apart. The visible costs are real, but they are not where most of the damage happens.
The Ramp Period: Months of Below-Quota Production
The average sales rep ramp time in 2026 is 5.7 months, and that is to reach baseline productivity, not full quota. During that period, the new rep generates a fraction of what a fully ramped rep would produce.
If a ramped rep closes $50,000/month in new revenue, and a new rep closes $15,000-$20,000/month during ramp, you are absorbing a $30,000-$35,000/month productivity gap for nearly six months. That is $150,000-$200,000 in foregone revenue per replacement.
Even after accounting for the salary you are paying the new rep, the net productivity loss is significant at any team size.
The Pipeline Gap During Search
Before you have hired the replacement, the territory sits vacant. Leads go unworked. Follow-up calls don't happen. Deals that needed one more conversation to close stall or go dark.
The average time to fill a sales role is 45-60 days. During that window, the pipeline your previous rep was working on deteriorates. Prospects don't wait. They find another solution, lose urgency, or go with a competitor.
For a rep managing a $500,000 pipeline with a 20% close rate, six weeks of neglect can cost $80,000-$100,000 in deals that don't close.
Manager Time: The Invisible Tax
When a rep turns over, the cost doesn't just fall on HR and finance. It lands hardest on the sales manager.
A rep transition typically consumes 30-40% of a sales manager's time for the first 60-90 days: recruiting, interviewing, onboarding, daily check-ins, deal support, and performance coaching. During this period, the manager's ability to support their remaining reps decreases. That degradation can spread across the entire team.
If your sales manager earns $120,000/year, 40% of their time for 90 days is roughly $15,000 in manager opportunity cost per turnover event. Multiply that across three replacements per year on a 10-person team.
Team Morale and Secondary Turnover
Turnover is contagious. When top performers watch a colleague leave, especially if they leave for better pay or a more exciting opportunity, it triggers re-evaluation.
One voluntary departure among high performers reliably increases the probability of additional voluntary departures in the following 30-60 days. High-performing reps are recruited constantly. Turnover events give recruiters an opening: "Your company seems to have a lot of movement. Have you ever thought about exploring options?"
The secondary cost of one departure can trigger another. The second one costs everything the first one did.
The Full Cost Calculation
Adding it up for a single mid-level sales rep (base salary: $70,000, on-target earnings: $120,000):
True Cost of One Sales Rep Departure
Mid-level sales rep. Base salary $70K, on-target earnings $120K. Bar width is proportional to cost.
At 35% annual turnover on a 10-person team (3–4 replacements/year), total annual cost: $645K–$910K.
Recruiting (15-20% of base): $10,500-$14,000
Onboarding and training: $3,000-$5,000
Ramp productivity gap (5.7 months): $140,000-$175,000
Pipeline loss during vacancy (45 days): $50,000-$80,000
Manager time during transition: $12,000-$18,000
Total per replacement event: $215,500-$292,000
The frequently cited figure of "$115,000 per rep" is conservative. It typically excludes the full pipeline impact. For roles with larger territories or longer deal cycles, total costs can easily exceed $300,000.
What This Means for a 10-Person Sales Team
At 35% annual turnover, a 10-person team loses three to four reps per year. Apply the math:
Speed versus selection quality: what each path actually costs
Illustrative numbers based on a $70,000 base salary rep and a $215,000 average replacement cost. Both paths assume the same 10-person team at 35% base turnover.
3 base turnovers + 2 additional mis-hire failures before tenure
3 base turnovers, almost no early mis-hire failures added
The quality path takes 25 more days to fill a role. It saves $430,000 per year on a 10-person team. Every extra day in hiring is paid back many times over in avoided replacement cycles.
- Conservative estimate (3 reps x $215,000): $645,000/year
- Realistic estimate (3.5 reps x $260,000): $910,000/year
For a small or mid-sized business generating $5-$10M in revenue with a 10-person sales team, sales rep turnover is likely consuming 10-18% of your total revenue in hidden costs. Most companies have no line item for this.
The Hiring Quality Connection
Not all turnover is avoidable, but a significant portion is caused before the hire, not after.
A study found that 46% of newly hired employees fail within 18 months (Leadership IQ) and 89% of those failures trace back to attitude and fit issues, not missing skills. These are detectable at an interview with a structured evaluation.
How one departure becomes two: the secondary turnover chain
Illustrative cost chain for a mid-level sales representative with a $70,000 base salary. Secondary departure probability reflects industry research on voluntary contagion following high-performer exits.
chance
The first departure is visible on the books. The second rarely is. It shows up as a missed quarter, a pipeline that went quiet, and a manager who was too stretched to catch early warning signs. Most finance teams have no line item for secondary turnover risk at all.
The investment in a more rigorous hiring process is cheap compared to the cost of one bad hire. An extra interview round, a work sample test, or a better competency framework each costs a fraction of a failed placement. A $5,000 investment in assessment tools that prevent a single $250,000 turnover event pays for itself 50 times over.
Knowing the red flags when hiring a salesperson is the simplest upstream prevention. The screening stage is where candidate fit signals surface before the first interview, reducing the probability of advancing a hire whose motivation, background, or expectations don't match the actual role conditions. Frontline hiring tools like Zyverno make that signal visible before a single interview slot is used.
For what hiring practices actually reduce turnover long-term, see how to reduce sales turnover.
Industry Benchmarks
Not all sales roles have equal turnover. Here are industry averages by role type:
Annual Sales Turnover Rate by Role Type
Industry averages, Xactly 2025
Sales development representative/business development representative: 40-50% annual turnover
Inside Sales: 30-35% annual turnover
Field account executive: 25-30% annual turnover
Enterprise account executive: 20-25% annual turnover
Sales Manager: 20-25% annual turnover
Technology and software-as-a-service organizations see 67% higher turnover than other sectors (Xactly, 2025), largely driven by aggressive recruiting and compressed compensation windows.
Companies that have introduced clear, achievable on-target earnings structures and built trust through pay transparency have improved rep retention by 12-15% (PayScale Compensation Best Practices, 2025). At scale, that means one or two fewer replacement events per year on a mid-sized team.
Frequently Asked Questions
What's the average tenure of a sales rep?
18 months across all sales roles. For sales development representatives specifically, average tenure is 14-16 months, meaning most sales development representatives leave before they have fully ramped and demonstrated sustained productivity. This makes the sales development representative role particularly expensive to staff without intentional retention programs.
Is 35% turnover normal for sales teams?
It is common, not normal. 35% is the industry average, which means many companies have accepted it as a fixed cost rather than a solvable problem. Companies that invest in better hiring selection, structured onboarding, and realistic quota-setting consistently run 15-20% annual turnover, roughly half the average.
How do I calculate the cost of turnover for my specific team?
Use this formula:
Total Turnover Cost = (Annual Reps Lost) x (Avg Ramp Loss + Recruiting Cost + Training Cost + Pipeline Loss + Manager Time)
Start with conservative estimates. Most sales leaders are surprised by how high the pipeline loss component is once they have calculated it honestly.
Does hiring faster reduce turnover costs?
Not necessarily. It often increases them. Faster hiring without better selection produces more mis-hires, which turn over faster than good hires. The goal is not to minimize time-to-hire but to minimize time-to-quota and maximize tenure. Those outcomes come from better selection, not faster selection.